It wasn’t straightforward finding an easy way to analyze my Amazon S3 logs. I unsuccessfully tried several instructions and services before arriving at the simple solution below. I looked into paid services like S3Log, S3STAT, and Qloudstat. I tried the free version of Qloudstat, until my logs quickly exceeded the “free” limit, so I never actually got to use their service. I looked at different tutorials that suggest using GoAccess or AWStats for example. But their solutions are more involved than I wanted to get.
I just want to run some reports and quickly analyze snapshots of my bucket activity. That’s when I ran across these simple instructions by Mr. Wahl, a Network Operations Manager currently at the Tweddle Group in Michigan. My instructions are based on his article.
Step 1: Download your logs
I used the free CloudBerry Explorer for Amazon S3 to browse to my bucket and download the log files onto my desktop. Logging must be enabled on your bucket or else you won’t find any logs to download.
Step 2: Combine your logs into a single file
Using the command prompt, navigate to the folder where you downloaded the S3 logs. run the command copy * combined_log_file which will create a new file named “combined_log_file” containing all the small logs in the directory.
Step 3: Open combined_log_file in Excel
Start Excel and, using the file menu, open a new excel file. Navigate to the directory where you created combined_log_file. Since this file is not recognizable by Excel, click the dialogue box that says “All Excel Files” and change it to “All Files”. This will allow you to see all the files in the directory, not just the ones Excel recognizes. Select the file combined_log_file.
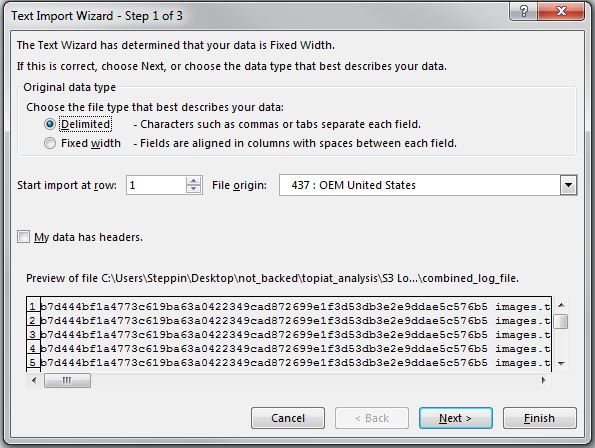
Step 4: Text Import Wizard Step 1: Select Delimited
Choose the Delimited option. The wizard defaults to Fixed width.
Step 5: Text Import Wizard Step 2: Check “Space” and “Tab”
Check off both the “Space” and “Tab” Delimiter options.
Step 6: Click Finish and Enjoy Analyzing!
One Caveat
This is an Excel based solution and Excel is not a database program; Excel has a hard-coded limit and will not load more than 1,048,576 rows of data (in this case, log entries). There some ways to get around this limit using pivot tables and the power pivot plugin. Check out this post to get familiar with the power pivot technique for “unlimited” rows. You can learn how to enable power pivot here and learn some basics on how to load data into it here.


Hi Steffon
A great way to analyze logs using Excel ! However we have just launched a new product in the market dedicated only to analyzing your AWS S3 & Cloudfront Logs ! Just visit cloudlytics.com and see how Cloudlytics is different from the others!
Hello Nilotpal – Your company Blazeclan and your product cloudlytics looks interesting. Have you thought about writing a post that compares your offering with others like S3Log, S3stat, and Qloudstat? I’d have to say, it’s quite difficult to see the difference between any of these just by visiting their websites.
Hey Steffon, sorry for the late reply.
It sounds like a good idea to write a blog that compares our offering with others like S3Log, S3stat, and Qloudstat. I have passed on the idea to my product team. Will keep you posted on any developments! Wanted to share, you can now avail the services of Cloudlytics on AWS Marketplace goo.gl/DiHMoX . Let us know if you have any feed backs at info@blazeclan.com