[box]• Think Advisor featured these results in their article Are You a Contrarian or Part of the Herd? on May 5th, 2015.[/box]
It’s no secret that many investors think alike. When they do, we say they have a “herd mentality”; when they don’t, we call them “contrarians”. And it’s usually speculation as to who’s which.
At least it used to be. I decided to run hedge fund holdings data through Curalytics to create a “thesis map” that identifies, of the over 3,100 institutional investor portfolios reported to the SEC (via form 13f), which are similarly constructed—e.g. “herd mentality”—and which are largely unique.
The thesis map (included below) visualizes similarities between portfolios, where similarity is defined as two or more portfolios containing 50% or greater of the same securities. Lines connect similar funds to “thesis groups” and clusters reveal concentrations of funds with similar theses. The Curalytics approach cuts through a fund’s stated philosophy because, at the end of the day, portfolios with the same securities end up in the same thesis group.
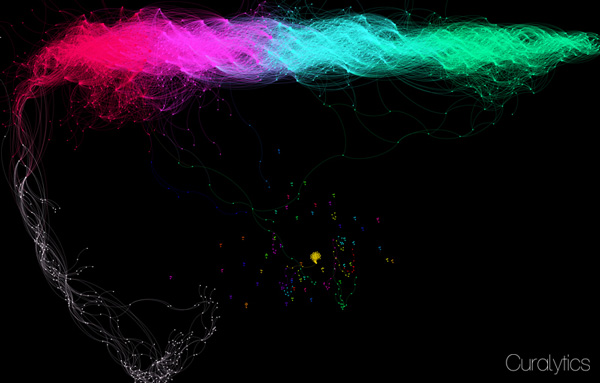
Download a high-resolution (2000x1275px) version of this image.
Download a high-resolution (2000×1275) version of this image
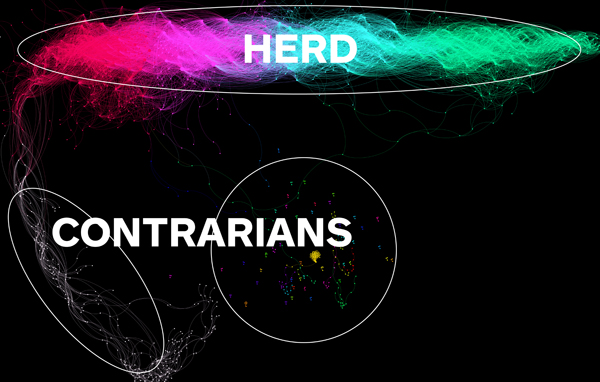
The thesis map shows 593 portfolios overlapping with at least 1 other portfolio, with an average thesis group containing 17.6 funds. Of note is the wide, horizontal cluster of funds, revealing what many already suspected: the herd is out there. The largest thesis group contains 46 funds while the thin strands on the left and the small clusters in the middle show thesis groups containing just a few funds. Variations in color reveal a spectrum of similarity within a herd itself.

With the ability to identify herds of investors, I’ve released the names of the top 50 largest herd investors from Q4 2014. All of the funds listed below picked securities that overlap 50% or more, almost entirely with each other:
THE CURALYTICS TOP 50 HERD INVESTORS FOR Q4 2014
- Aberdeen Asset Management PLC/UK
- Adage Capital Partners GP LLC
- Amalgamated Bank
- Andra AP-fonden
- APG Asset Management N.V.
- Aviva PLC
- British Columbia Investment Management Corp
- Caisse De Depot Et Placement Du Quebec
- Chevy Chase Trust Holdings, Inc.
- CIBC Asset Management Inc.
- Cornerstone Advisors, Inc.
- Dai Ichi Life Insurance Co., Ltd.
- Daiwa Securities Group Inc.
- Delta Lloyd NN
- Euclid Advisors LLC
- Fjarde Ap-Fonden /Fourth Swedish National
- Gateway Investment Advisers LLC
- GLG LLC
- Gulf International Bank (UK) Ltd.
- Hartford Investment Management Co.
- Henderson Group Plc
- Korea Investment Corp
- Livforsakringsbolaget Skandia, Omsesidigt
- Lloyds Banking Group Plc
- Lombard Odier Asset Management (Switzerland) SA
- LS Investment Advisors, LLC
- Mitsubishi UFJ Asset Management Co.
- Mizuho Asset Management Co.,Ltd.
- New Mexico Educational Retirement Board
- Nomura Asset Management Co Ltd.
- Norinchukin Bank, The
- Old Mutual Global Index Trackers
- Ontario Teachers Pension Plan Board
- PartnerRe Asset Management CORP
- Pictet Asset Management Ltd.
- QS Investors, LLC
- Robeco Institutional Asset Management
- Royal London Asset Management Ltd.
- Sentry Investment Management Inc.
- Shapiro Robert N
- Shinko Asset Management Co., Ltd.
- Standard Life Investments Ltd.
- State Treasurer State Of Michigan
- Sumitomo Mitsui Asset Management Company, Ltd/
- TD Securities (USA) LLC
- Tokio Marine Asset Management Co Ltd.
- Toronto Dominion Bank
- Wealthfront Inc.
- Westpac Banking Corp
- Zurcher Kantonalbank (Zurich Cantonalbank)
The idea for the thesis map came out of my realization that constructing a portfolio of stocks is in fact, stock “curation”. While Curalytics is typically used to identify like-minded consumers—via their curation of songs into playlists, products into wish-lists, or images into galleries—it can also identify like-minded investors based on their curation of stock portfolios. It would be great to start applying this technology to portfolio management, fund marketing, and portfolio diversification analysis.
Image credit: The featured image of a “geometric sheep” is by Kevin Harald Campean, a talented graphic artist from Budapest, Hungary.